
Why many clients still rely on Excell?
Excel is so popular because it is a versatile, reliable, and user friendly tool for managing and analyzing data, offering a wide range of features from simple calculations to complex data models, and integrating well with other software. Its long standing presence, constant updates, and ubiquitous use in businesses across almost all professions have cemented its status as the industry standard. But as data grows more complex and collaboration becomes essential, many professionals are starting to feel Excel’s limitations like:
• Data Security: Easily shared files can lead to unauthorized access or accidental data loss.
• Manual Workload: Time consuming data entry and report creation reduce focus on analysis.
• Limited Collaboration: Single user editing and version conflicts slow down teamwork.
• Accuracy Issues: Human errors in formulas or entries can impact key decisions.
Now imagine a tool that doesn’t just patch Excel’s weaknesses, it completely transforms the way you work with data. Power BI isn’t just a fancy upgrade. It’s a smarter, faster, and more secure way to manage, visualize, and share your data. Whether you’re tired of manual updates, clunky visuals, or version conflicts, Power BI gives you the tools to work effortlessly and professionally.
How Power BI solves the biggest problems we all face with Excel?
• Manual updates? With Power BI, your data refreshes automatically from live sources. No more copy paste or late-night spreadsheet edits.
• Limited visuals? Power BI gives you stunning, interactive dashboards that actually make sense and look professional.
• Hard to share reports? Just publish your report to the cloud and control who sees what. No more emailing files back and forth.
• Static files? Power BI lets you collaborate in real time. You can drill down into data, filter views, and explore insights together.
• Error-prone formulas? Power BI uses DAX a powerful formula language that’s built for accuracy and scalability. No more broken cells or hidden mistakes.
Real-World Power BI Case Studies:
Before we dive deeper into how Power BI transforms workflows, let’s look at real-world examples, these stories show how Power BI isn’t just a tool, it’s a game-changer.
My Learning Journey: From Excel Assumptions to Power BI Mastery:
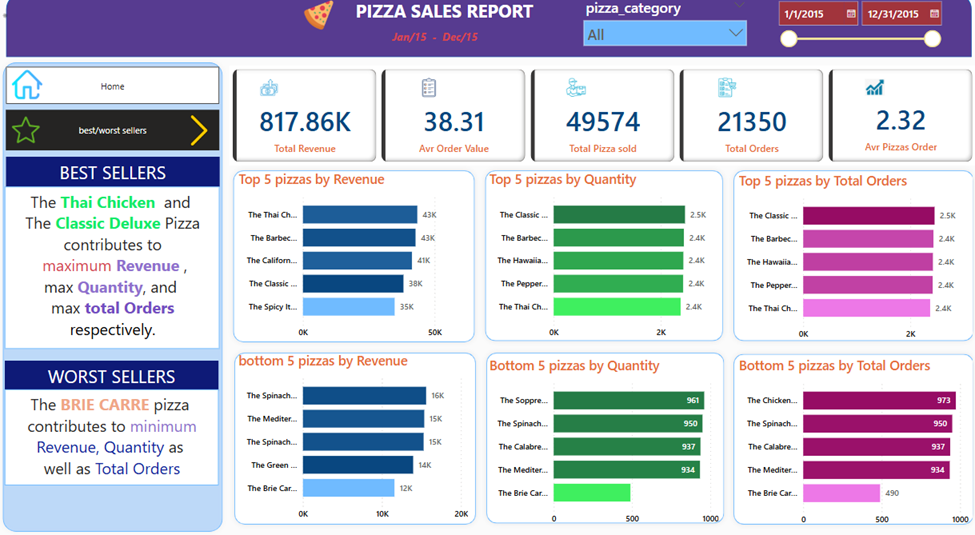
When I first started working with Power BI, I assumed it was just a more advanced version of Excel. But once I got hands-on with a real dataset “pizza sales data” I quickly realized how different and powerful Power BI truly is.
Step 1: Data Cleaning with Power Query Editor
The first thing I learned was how crucial data cleaning is. Using Power Query Editor, I explored techniques to remove errors, transform columns, filter unnecessary rows, and prepare the dataset for analysis. This step alone taught me how to handle raw data more professionally than I ever could in Excel.
Step 2: Data Modeling
Next, I moved into data modeling. I connected multiple tables and built relationships between different columns like pizza categories, sizes, and order dates. This unlocked new insights that weren’t visible in flat Excel sheets. I began to understand how relational models can reveal patterns across dimensions.
Step 3: Creating Measures and Aggregations
To make the data truly useful, I created custom measures and calculated fields using DAX. These helped me calculate total revenue, average order value, and other KPIs dynamically. This was a game changer it allowed me to aggregate data in ways that were both flexible and accurate.
Step 4: Visualizing Insights
Once the data was ready, I moved to the reporting canvas. Using a variety of visuals bar charts, pie charts, KPIs, and line graphs. I brought those insights to life. You can see the results in the screenshots below. Each visual tells a story, whether it’s about top selling pizzas or peak sales periods.

AI-Powered Features in Power BI
Beyond traditional visuals, Power BI also offers AI-driven tools that take reporting to the next level:
• Predictive Analytics: You can use AI visuals to forecast trends and suggest future business actions based on historical data.
• Q&A Visuals: Power BI allows users to ask natural language questions (like “What were the top-selling pizzas in July?”). Even if that visual wasn’t pre-built, Power BI can automatically generate it and display the relevant data.
• Instant Insights: If a user asks for information that wasn’t explicitly modeled or visualized, Power BI can still interpret the query and create a new visual on the fly thanks to its semantic understanding and AI capabilities.
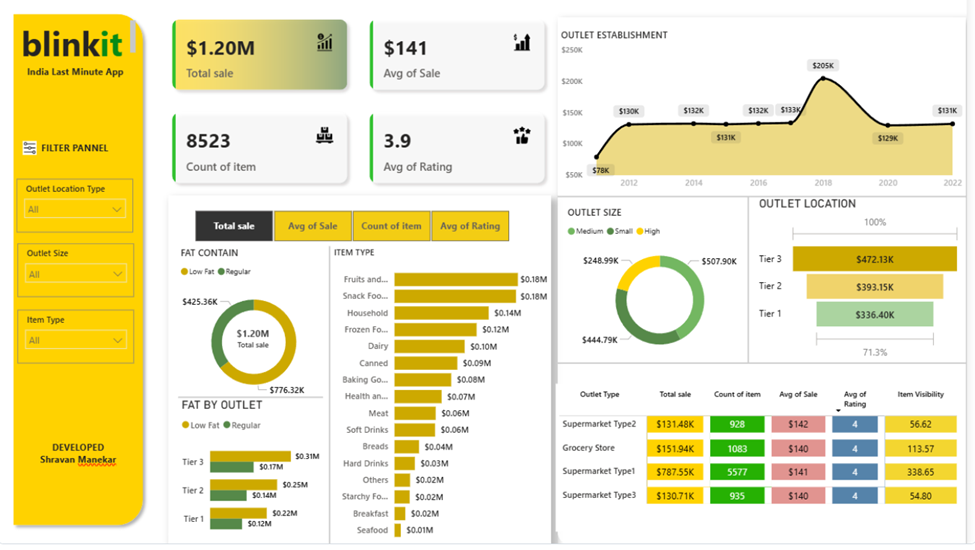
Freelance Power BI:
Let me introduce you to Shivam, a freelance data analyst who didn’t wait for a client to hand him a project, he created one himself. Shivam built a full-fledged Power BI dashboard analyzing Blinkit’s grocery sales data. His goal? To showcase his skills, solve a real business problem, and build a portfolio that speaks louder than any resume.
- What he did:
- • Pulled Blinkit’s sales data and cleaned it using Power BI
- • Created interactive visuals showing outlet performance, product categories, and sales trends
- • Used DAX formulas to calculate MTD, QTD, YTD, and YoY growth
- • Designed a dashboard that’s not just functional but client ready
- What did Shivam gain?
- • A standout portfolio project
- • Real-world experience with Power BI
- • Visibility on GitHub and LinkedIn
- • A powerful tool to attract future clients and freelance gigs
From Raw Data to Smart Decisions Power BI Visuals:
Explore Shivam’s full project on GitHub: Click ->GitHub
Shivam’s freelance project aligns closely with a research paper published in the International Journal of Research in Engineering and Innovation (IJREI). The paper explores Blinkit’s sales data using Power BI and highlights how data visualization can uncover deep business insights. This academic study validates the kind of work freelancers like Shivam are doing. It shows that Power BI isn’t just for big corporations, it’s a tool that anyone can use to deliver serious value.
Read the full research paper here: Power BI Case Study – IJREI PDF
NHS Transforms Healthcare Reporting with Power BI:
The UK’s National Health Service (NHS) faced serious challenges with Excel based reporting delayed decisions, scattered data, and limited collaboration across departments. By switching to Power BI, they centralized patient care data, staffing metrics, and operational KPIs into live dashboards.
- What changed?
• Real-time visibility into bed availability and patient flow
• Faster, data-driven decisions across hospitals
• Secure, role-based access for different teams
• Reduced manual reporting and improved accuracy
Read the official NHS Power BI case study: NHS England – Data and Analytics
This case proves that even large, complex organizations can benefit from Power BI’s simplicity, speed, and collaborative power.
Power BI vs Excel: Top Differences You Need to Know:
| Feature | Excel | Power BI |
|---|---|---|
| Data Capacity | Handles up to 1 million rows but slows down with large datasets | Optimized for big data, can process millions of rows efficiently |
| Data Security | Password-protected files, limited security options | Role-based access, enterprise-grade security, cloud encryption |
| Flexibility | Best for manual data entry, spreadsheets, and basic calculations | Best for automation, large-scale analytics, and business intelligence |
| Learning Curve | Easy for basic tasks, but advanced features (VBA, Power Query) take time | Steeper learning curve but built for visual data analysis |
| Accessibility & Collaboration | Limited to file-sharing (email, OneDrive) | Cloud-based collaboration, accessible from anywhere |
| Visualization Options | Charts, pivot tables, and graphs | Interactive reports, AI-powered visuals, and real-time dashboards |
| Interactivity | Static reports with basic filtering | Clickable, interactive dashboards with drill-down features |
| Automation & AI Features | Uses VBA/macros for automation | Built-in AI insights, anomaly detection, and automated updates |
| Cost & Licensing | One-time purchase or Microsoft 365 subscription | Free version available, Pro and Premium require monthly fees |
| Customization & Extensibility | Uses VBA and add-ins for customization | Supports APIs, custom visuals, and Power Automate for workflow automation |
From Manual to Magical: Power BI Time-Savers for Excel Users:

Conclusion: From Spreadsheets to Smart Decisions
If you’ve ever felt stuck juggling Excel sheets, manually updating reports, or struggling to make sense of scattered data you’re not alone. Many professionals start there. I did too.
But once I stepped into Power BI, everything changed. From cleaning messy data in Power Query to building relationships across tables, creating dynamic measures, and visualizing insights with purpose Power BI turned raw numbers into real stories. And with AI-powered features like predictive visuals and natural language Q&A, it’s not just a reporting tool it’s a decision-making engine.
Whether you’re a freelancer building dashboards for clients, a student exploring data analytics, or a business owner looking to optimize performance, Power BI gives you the edge Excel simply can’t.
And as you saw in the examples from my own pizza sales dashboard to Shivam’s Blinkit project and the NHS transformation real-world impact starts with the right tools and mindset.
So if you’re still relying on Excel for everything, maybe it’s time to ask: What could you discover if your data worked smarter, not harder?