Introduction:
Whether you’re a freelancer or someone working with data in any department, we all know the struggle when data isn’t clean or is scattered across different platforms. Maybe part of a client’s data is stored in a cloud based tool, some of it’s tucked away in spreadsheets, and the rest is present inside one or two databases. Trying to pull that data together in the right order becomes a stressful task, and making sense of it all? That’s even harder. It’s messy, time-consuming, and honestly, not the kind of work that gets us excited.
Now imagine if one tool could connect to all those sources, fetch the data, clean it up, and turn it into something meaningful. That’s exactly what Power BI does. It’s a data companion built to pull information from almost anywhere “Excel files, Google Sheets, SQL databases, APIs, cloud services", etc. And once the data’s in, Power BI helps you clean, model, and visualize it like a pro.
In this blog, I’ll walk you through the different data sources Power BI supports, and more importantly, how tapping into them helps freelancers like us work faster, smarter, and more professionally. Whether you’re building client dashboards or streamlining your own workflow.
Section 1: Where Power BI Can Fetch Data From
Power BI can fetch data from a wide variety of sources, whether it’s a simple Excel file or a live cloud stream. For freelancers, this flexibility means you can build smarter reports no matter where your data is scattered:

1. File-Based Sources
These are the most common starting points for freelancers, especially when clients send raw files via email or shared folders.
-
Excel (.xlsx, .xls ): Power BI connects directly to Excel workbooks, letting you select specific sheets, named ranges, or tables. You can even combine multiple Excel files from a folder into one unified dataset.
-
CSV, XML, JSON: These formats are often used for exports from other tools. Power BI reads them easily and lets you transform the structure using Power Query Editor. JSON is especially useful when working with nested data from APIs.
-
PDF Tables: Got a report embedded in a PDF? Power BI can extract tabular data directly from it, no more manual copy-paste or retyping.
-
SharePoint Folders: If your client uses SharePoint to store files, Power BI can connect to the folder and automatically combine all the files inside. This is perfect for recurring reports or monthly uploads.
2. Cloud Services
Cloud storage is where most modern teams keep their data. Power BI makes it easy to connect and stay synced.
- Google Sheets: Connect using the sheet’s URL and credentials. Any updates made in Google Sheets reflect in Power BI after refresh, great for collaborative teams.
- OneDrive & Dropbox: These act like live folders. When a file is updated or replaced, Power BI picks up the change automatically. No need to re-import or reconfigure.
- SharePoint Online: Beyond just files, you can connect to SharePoint lists and document libraries. This is especially useful for organizations using Microsoft Teams or Office 365.
3. Databases
When you’re working with structured data at scale, databases are the backbone. Power BI connects to both on-premise and cloud databases.
- SQL Server, MySQL, PostgreSQL: These are common in small businesses and startups. Power BI lets you write custom queries or pull entire tables.
- Oracle, IBM Db2: Often used in enterprise environments. Power BI supports secure connections and scheduled refreshes.
- Azure SQL, Amazon Redshift: Cloud-native databases that scale with your client’s business. You can use Direct Query for real-time data or Import mode for faster performance.
4. Online Services & APIs
This is where things get exciting connecting directly to the tools your clients already use.
- Google Analytics & Facebook Ads: Pull campaign performance, traffic metrics, and ad spend directly into Power BI. No need to export CSVs every week.
- Salesforce: Access CRM data like leads, opportunities, and sales pipelines. You can build dashboards that sales teams actually use.
- Mailchimp & HubSpot: Track email campaigns, subscriber growth, and engagement metrics. Perfect for marketing freelancers and consultants.
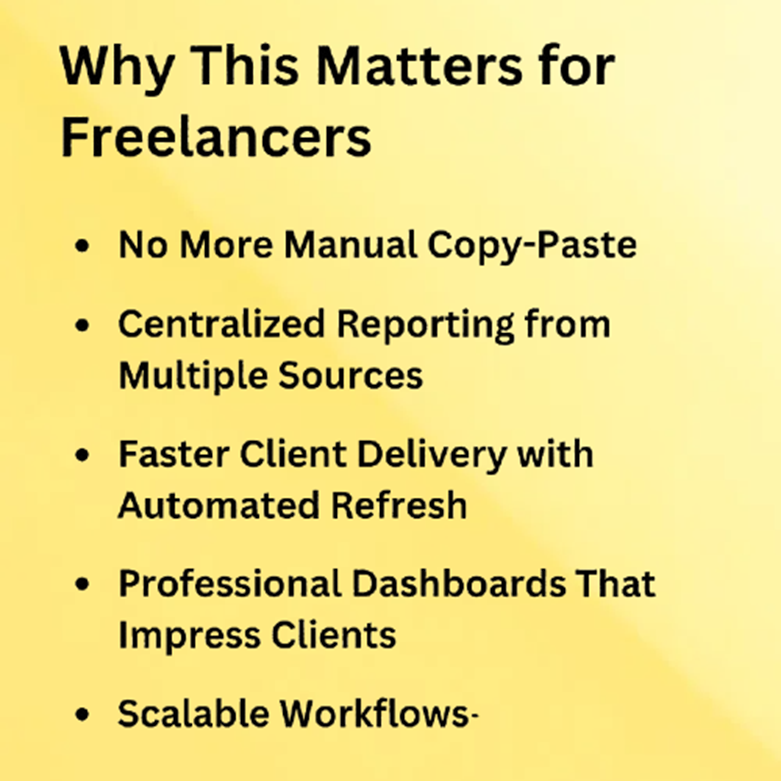
Section 2: Why This Matters for Freelancers
Let’s talk about the real-world impact. Because as freelancers, we’re not just building dashboards we’re managing deadlines, juggling clients, and trying to deliver work that actually makes a difference. Here’s why Power BI’s data connectivity is a essential and power full feature.
-
No More Manual Copy-Paste:
-
We’ve all wasted hours copying data from one sheet to another, fixing column headers, and double-checking formulas. With Power BI, that’s gone. You connect once, set up your transformations, and let it refresh automatically. It’s like telling your future self, “Don’t worry I’ve already handled it.”
-
Centralized Reporting from Multiple Sources:
-
Client data rarely lives in one place. Maybe their sales numbers are in Excel, marketing stats in Google Sheets, and CRM data in HubSpot. Power BI pulls all of it together into one clean, unified report. No more switching tabs or merging files just one dashboard that tells the full story.
-
Faster Client Delivery with Automated Refresh:
When your data updates automatically, your reports stay fresh without lifting a finger. That means faster turnaround, fewer revisions, and more time to focus on insights instead of grunt work. Clients love it and honestly, so will you. -
Professional Dashboards That Impress Clients:
Let’s be honest: a well-designed Power BI dashboard looks and feels like something built by a full team. Interactive visuals, drill-downs, KPIs it’s the kind of work that makes clients say, “Wow, you built this?” And yes, you did. -
Scalable Workflows—Handle More Clients Without Burning Out :
-
Once your reporting workflow is automated, you’re not stuck in the weeds anymore. You can onboard new clients, reuse templates, and scale your services without working longer hours. That’s how you grow your freelance business sustainably by working smarter, not harder.
Section 3: Real- Use Cases:
Case 1 : Imagine you’re working with a client who sends:
- sales data in Excel
- marketing data from Facebook Ads
- customer feedback from Google Forms
Instead of juggling three tools, you connect all of them to Power BI, build one dashboard, and set it to auto-refresh weekly. Now your client gets insights without you lifting a finger.
Case 2: Freelance Marketing Consultant for a Startup
You’re working with a startup that runs paid ads and email campaigns. They give you:
- Facebook and Google Ads performance (CSV exports)
- Email campaign stats from Mailchimp
- Website traffic data from Google Analytics
You connect all of it to Power BI and build a dashboard that shows:
- Which campaigns drive the most conversions
- How email open rates correlate with ad spend
- What time of day brings the most traffic
These are just a few examples, there are numerous ways and sources from which you can fetch data into Power BI. As you can see in the screenshot below, Power BI offers a wide range of data connectors.

There are over 250 native connectors available covering many popular data sources like SQL Server, Excel, Salesforce, Google Analytics, Azure …
Section 4: Bonus – AI + Data Sources
Now here’s the part that really sets Power BI apart its built-in AI features. No matter where your data comes from Excel, Google Sheets, SQL, or APIs Power BI adds a layer of intelligence that helps you go beyond just reporting. It’s like having a mini data analyst working alongside you.
-
Q&A Visual:
Ever wished you could just ask your dashboard a question? With Power BI’s Q&A feature, you can. Type something like “Top product last month” or “Total sales by region” and Power BI will instantly generate the right visual. It understands natural language, so even non-technical clients can explore the data without touching a single chart.
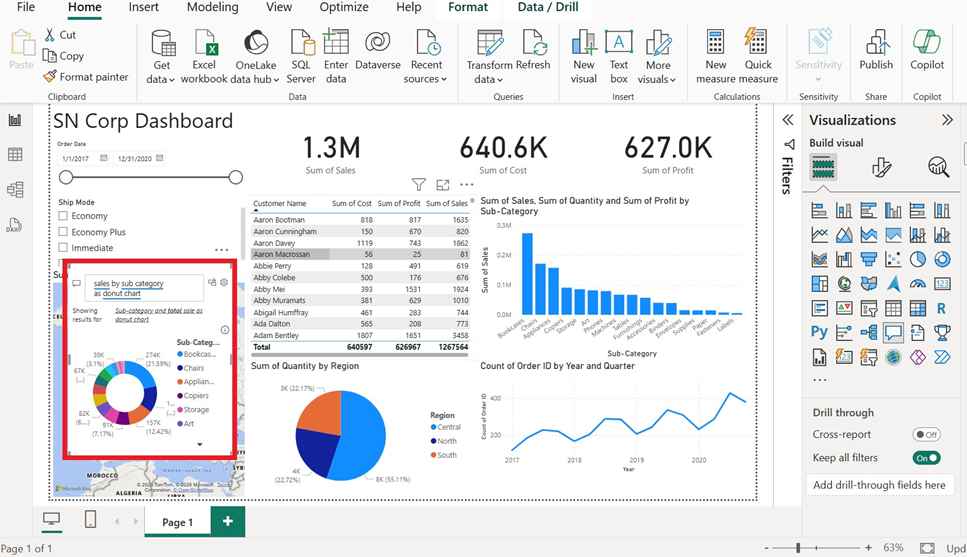
Below in my personal project dashboard, you can see (highlighted in red) how I used the Q&A feature to request a sales report directly from the data. Power BI responded by generating a Donut chart, even though I hadn’t created that visual manually before. This shows how a client can ask for anything using this feature. Power BI isn’t just dynamic, it’s truly interactive for both the user and the client. No formulas, no complex data modeling, just instant insights. -
-
Smart Narratives
This one is a game changer. Power BI can automatically generate written summaries based on your visuals. So instead of manually explaining trends, you get a built-in narrative that updates as your data changes. It’s perfect for client presentations or executive dashboards where quick insights matter. -
Forecasting
Power BI can help you look ahead. Its forecasting feature uses built-in algorithms to predict future trends, whether it’s sales, traffic, or engagement. You don’t need to be a data scientist, just drag the visual, enable forecasting, and Power BI does the rest.
Conclusion: Power BI Isn’t Just About Visuals It’s About Connection
If there’s one thing I’ve learned on this journey, it’s that Power BI isn’t just a tool for building pretty dashboards. It’s a bridge a way to connect scattered data from anywhere and turn it into something meaningful.
Whether your client sends you Excel sheets, cloud exports, or database access, Power BI helps you bring it all together. And once you do, everything changes: your workflow becomes smoother, your reports become smarter, and your clients start seeing you not just as a freelancer but as a data partner.
So here’s my challenge to you: Try building a dashboard from two different sources this week just one project. You’ll never look back.
Once you see how effortless it can be, you’ll wonder how you ever managed without it.